Oregon’s Per Capita Personal Income 2017
Oregon’s total personal income ranked 26th in the nation in 2017, one spot below the 2016 rank. Data on personal income comes from the Bureau of Economic Analysis, a division of the U.S. Department of Commerce.
State personal income captures total income within a state and is the sum of three main components: net earnings (wages, salaries, employer contributions); personal current transfer receipts (retirement, Medicare, unemployment insurance); and dividends, interest, and rent.
Growth in personal income for the U.S. overall averaged 4.4 percent in 2017, an increase of 1.8 percentage points from the previous year’s rate of growth (2.6%). For individual states in 2017, growth ranged from a 0.7 percent decrease in North Dakota to a 6.1 percent increase in Washington. Personal income grew by 5.2 percent in Oregon in 2017, which was the eighth fastest in the nation. The previous year, Oregon’s rate of growth was 4.8 percent, which was third in the nation.
Growth in the three components of personal income changed at varying levels over the past year. Growth in net earnings increased from a 5.4 percent increase in 2016 to a 6.2 percent increase in 2017. Growth in dividends, interest, and rent slowed just slightly from 4.7 percent in 2016 to 4.6 percent in 2017. Growth in personal current transfer receipts slowed from 3.0 percent in 2016 to 2.6 percent in 2017.
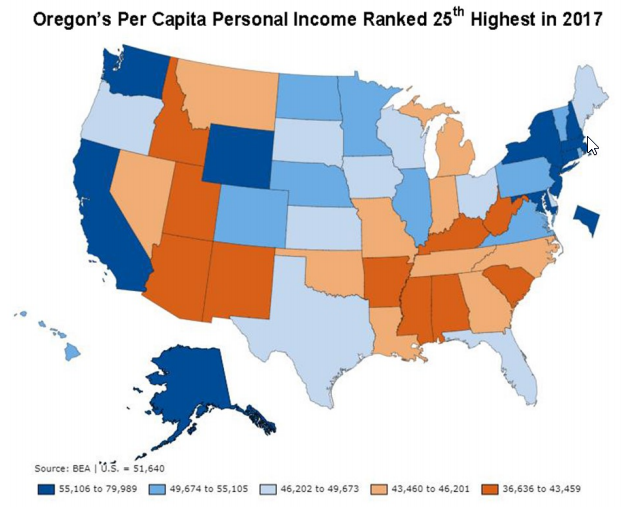
Per Capita Personal Income
The size of a state’s population plays a predominant role in the size of its total personal income. California, Texas, Florida, New York, Pennsylvania, and Illinois – six of the most populous states in the nation – are also the top six states in terms of total personal income. South Dakota, North Dakota, Alaska, Vermont, and Wyoming – five of the least populous states in the nation – are also the bottom five states in terms of total personal income.
By dividing a state’s total personal income by its total population, we obtain per capita personal income (PCPI). This gives us a number that is more easily compared with other states. For instance, Oregon’s total personal income was just over $199 billion in 2017, while Texas’ was more than $1.3 trillion. Per capita personal income, however, was $48,137 for Oregon and $47,362 for Texas.
Adjusting to PCPI adjusts the income rankings of states as well. Connecticut ranked 23rd in total personal income and 29th in population but ranked first in the nation in PCPI. Mississippi ranked 34th in population and 35th in total personal income, but Mississippi ranked last of the states in PCPI. Oregon ranked 27th in population, 26th in total personal income, and ranked 25th in per capita personal income.
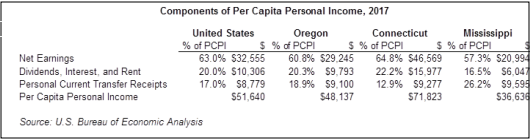
Comparison of PCPI Components For the United States as a whole, 63 percent of PCPI came from net earnings in 2017. Connecticut took the top slot and Mississippi took the bottom in dollar value of per capita net earnings. For Connecticut, 64.8 percent of PCPI came from net earnings and for Mississippi, it was 57.3 percent. Oregon ranked 30th among the states in per capita net earnings ($29,245), which accounted for 60.8 percent of the state’s PCPI in 2017.
Many states ranked similarly in dividends, interest, and rent per capita as they did in net earnings per capita. Oregon ranked 24th in dividends, interest, and rent per capita. Connecticut ranked second and Mississippi 49th in per capita dividends, interest, and rent.
States that ranked high in per capita net earnings receipts and states that ranked low in per capita earnings generally ranked higher in per capita transfer receipts. This makes sense. If you are earning income, either through wages or dividends and interest, then you are less likely to need transfer receipts to cover basic living expenses. Oregon, which ranked near the middle in both per capita net earnings and per capita dividends, interest, and rent, moved to 20th highest in per capita transfer receipts. Connecticut ranked 18th and Mississippi ranked 12th in per capita transfer receipts.
Oregon’s Population-Driven Relative Trend
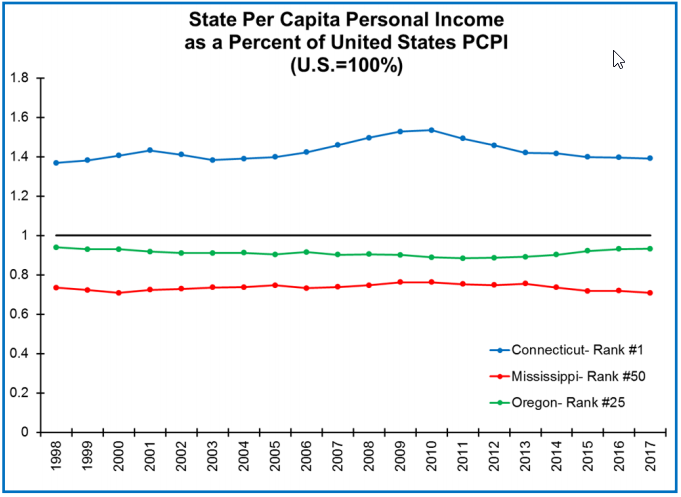
Oregon’s PCPI has remained close to the U.S. level since estimates began in 1929. The largest difference between the Beaver State and the U.S. came in 1943 when Oregon climbed to its peak of 123.8 percent of the national level. Oregon’s PCPI was consistently above the U.S. from 1938 to 1956 when incomes were bolstered by defense manufacturing for World War II and the post-war economic boom. In 1943, war-related manufacturing propelled Oregon’s PCPI to its highest level relative to the nation.
In 2009, Oregon’s PCPI dropped below 90.0 percent of the national level for the first time. And the state’s PCPI reached its lowest relative point (88.1%) in 2011. This was largely influenced by two main factors: the Great Recession of 2007 to 2009; and Oregon’s fast population growth. The Great Recession brought job loss and lower earnings, while at the same time Oregon’s population increased as well. Many states with high annual growth in population are also states with low annual growth in PCPI. This relationship can greatly impact a state’s per capita income relative to the national level.
The Grass Is Greener in Oregon
Oregon’s PCPI relative to the U.S. showed a slow upward trend from 2013 to 2017. In 2013, Oregon’s PCPI was 89.2 percent and by 2017 it had reached 93.2 percent of the U.S.’s PCPI. Population growth works to drive PCPI downward, while income growth works to drive PCPI upward. Oregon’s 2017 population growth rate was eighth in the nation. The 2017 total personal income growth rate was also eighth in the nation. The PCPI growth rate for Oregon was sixteenth in the nation.
Continued economic expansion that includes fast job growth, potentially high wages, technology-based industries, and increasing opportunities, along with an attractive Oregon lifestyle, brings new residents to Oregon. We like it here. You might too. And that’s one reason why Oregon’s PCPI was 93.2 percent of the U.S. PCPI in 2017.
Christopher Rich
Regional Economist
Baker, Grant, Harney, Malheur, Union, and Wallowa counties christopher.m.rich@oregon.gov
1901 Adams Avenue La Grande, OR 97850

Advertisement